Introduction to Precision
Agriculture :
Sources of Soil and Crop Yield Variation
within a Field
The objectives of this guide are to illustrate the effect
of natural and management induced sources of variation in the field on the spatial
patterns seen in yield maps, in field maps of soil parameters and to present
interpretation strategies.
 Precision
Agriculture (PA) is a crop management system that attempts to match the inputs
with the actual crop needs for small areas or zones within a farm field. Instead
of managing whole fields as a single unit, the management is altered to meet
the crop needs of different zones within fields. For PA to be viable, both economic
and environmental benefits must be considered, as well as the practical questions
of suitable technology such as variable-rate fertilizer spreaders. The management
challenge is to optimally manage the zones within the field that have different
production capacities. Therefore this means that there may not be a uniform
yield throughout the field, rather the yield potential of each zone is
maximized.
Precision
Agriculture (PA) is a crop management system that attempts to match the inputs
with the actual crop needs for small areas or zones within a farm field. Instead
of managing whole fields as a single unit, the management is altered to meet
the crop needs of different zones within fields. For PA to be viable, both economic
and environmental benefits must be considered, as well as the practical questions
of suitable technology such as variable-rate fertilizer spreaders. The management
challenge is to optimally manage the zones within the field that have different
production capacities. Therefore this means that there may not be a uniform
yield throughout the field, rather the yield potential of each zone is
maximized.
Field Variability and Remedial Measures
Knowing that yield variation exists is one thing, but
deciding what to do about it is another. Crop yields will vary within a field
because of available moisture (depends on soil texture, soil depth, organic
matter), available nutrients (depends on soil texture, level of nutrients, soil
depth), drainage, soil pH, weed pressure etc (Figure
1 ). Many other factors will affect the yield either alone
or in combination. Yield maps simply quantify the degree of the variation from
point to point, and present it in a visual format. There are many factors that
limit crop yields and a yield map only shows that there is a problem but not
which factors are limiting the yield. Therefore, interpreting a yield map to
make management decisions can be very difficult. The yield map indicates where
the problem zones are in the field and the general magnitude of the yield differences.
The producer has to determine the causes of the yield variations and whether
these factors can be altered by changes in production practices (not all changes
are possible or economically feasible). A yield map is a visual report on what
happened on the field last year. What happened last year might
not happen in the following year either due to a change in the weather pattern
or due to the response of a different crop.
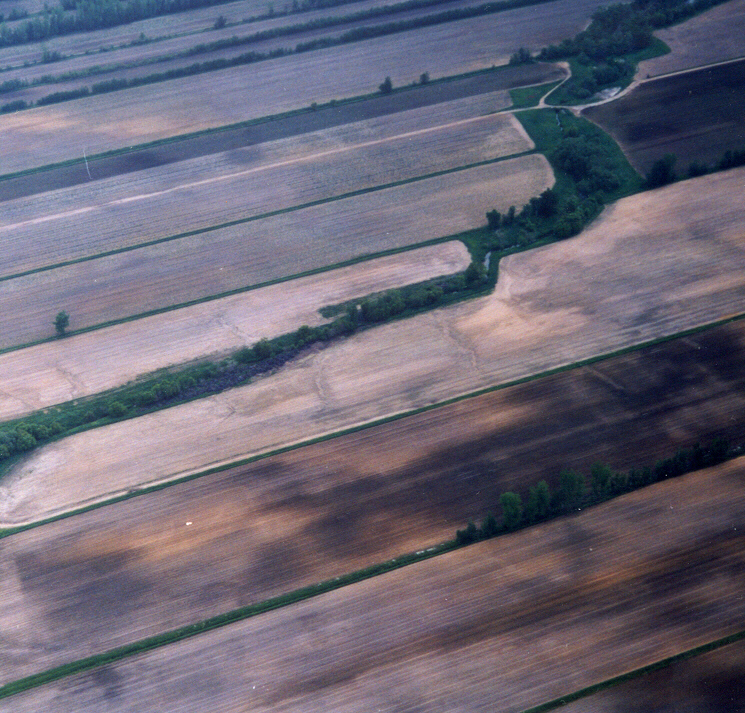
Variability in a field is a result of both natural factors
and management practices. The soil varies due to soil forming factors such as
parent material (marine heavy clay, river sand etc), topography (level
or rolling), biological activity (originally a forest -conifers or deciduous-,
swamp or grassland), climate (temperature and precipitation) and time. Management
practices such as tillage, fertilization and manure spreading can cause variation
in the field. Moldboard plows tend to remove soil from the tops of knolls and
deposit it downslope - this causes organic matter and nutrients to accumulate
downslope. Events from the past, 30 years or more, such as old drainage ditches
that are now filled in, can often be distinguished when soil nutrient levels
are mapped as shown in Figure
2.
The question is whether the crop yield response to input
such as nitrogen (N) or phosphorus (P) varies significantly within a field.
If the answer is yes, then under uniform fertilizer or manure application, some
parts of the field may not be receiving sufficient levels of nutrients to reach
their maximum potential while other parts may be receiving excess amounts, which
may have environmental implications. The best situation would be to vary the
inputs spatially to meet the varying needs of the crop at different locations.
If soil and water systems seem uniform (no change in soil colour, flat topography,
etc.) throughout the field and the yield maps show relatively consistent yields
(the range between maximum and minimum yields is small) then it may not be economical
to apply precision farming technologies such as variable rate applications of
fertilizer or lime. In some cases there may be no economically viable method
of "fixing" the problem that limits yield such as shallow topsoil depth.
Precision Agriculture: The Components
1. Information:
The application of PA can be seen as a management tool.
The choice of agricultural management practices at the field scale that maintain
productivity and protect the environment is often a complex procedure. One question
is how much information is needed to use PA. Data collection such as soil sampling
and interpretation of soil analyses and yield maps can be expensive and time
consuming. It is very important to know how this information can benefit crop
production and over all decision-making. Some fields require little information
to determine the cause of yield variability (rolling topography) while other
fields require extensive data collection and even then yield variation may still
be unpredictable. Management practices that can fix the cause of reduced yields
range from easy to difficult, cheap to expensive and have varying levels of
success. The decision to alter the management practices in low yielding areas
must be based on the degree and magnitude of yield variability, the correct
identification of the reason for the low yield and the economic viability of
the remedial actions.
2. Global Positioning System
GPS (Global Positioning System) is used by yield monitors
on combines to produce geo-referenced yield maps. Crop yield data is collected
every 10 seconds (or other time intervals) over the area determined by the swath
width and distance traveled by the combine. Each yield data point has a latitude
and longitude position. Each yield point on the map can be directly related
to a point in the field. Geo-referencing is the use of latitude and longitude
readings from a GPS receiver to place soil nutrient levels, texture, elevation
features and yield at their exact location on the field. GPS records are the
foundation for site-specific management (precision agriculture). (see Appendix
I for more details)
3. Yield Monitor Data
Yield measurement is subject to many random and systematic
errors such as:
- When the combine is filling to threshing capacity,
- When the combine has stopped moving and the grain
is emptying,
- At the beginning or end of a swath,
- When turning,
- In rolling topography or wet conditions,
- When the combine is plugging and during breakdowns.
Many of the yield mapping software associated with the
yield monitor will clean-up the data, such as the removal of extremely high
or low yield data points. However errors in the yield can still remain on the
maps. The producer should carefully examine and evaluate the yield maps using
their own knowledge of the field. Yield maps are only an approximation of crop
yield at a given location due to several reasons, one is that the flow of grain
in the combine does not start and stop abruptly. The crop cut at the edges of
the combine header takes longer to reach the sensor than crop cut at the center
of the combine header. As well, there is a 'smoothing' effect of the combine,
yield monitors tend to overestimate the low yielding areas and underestimate
the high yielding areas. The following WebSite has further details on yield
monitors http://muextension.missouri.edu/xplor/envqual/wq0451.htm
4. Yield Maps
Yield maps are becoming commonplace however interpreting
these yield maps are proving more difficult than producers and agronomes had
anticipated - many factors interact to affect crop yield within a given field
and year. As well yield maps may not be stable from year to year. The high and
low zones may change, depending on climate or other factors. For example in
a dry year, the sand soils in a field will have low yields, yet in a wet year
these same soils will probably have higher yields than the clays in the same
field. Points to remember when evaluating the yield maps.
- A yield map only documents the spatial distribution of crop yield and does
not explain what factors caused the variations.
- A yield map reflects all the inputs, environmental variables and field variability
of the previous crop. The usefulness of a yield map for the following season
is uncertain even for the same crop.
- The key to yield map interpretation is to understand more about the causes
of yield variation and which causes can be altered by crop management.
- If the ranges for yield are not selected properly,
the appearance of the map can be misleading. Figures 3
and 4
are yield maps of the same crop in the same field for one year.
Figure 3
appears to have less variation than Figure
4, but they are two visual
representations of the same yield.
Yield mapping will be valuable only when producers can turn this information
into better management decisions in their operation. However yield mapping is
relatively low-cost as compared to intensive soil sampling and it provides complete
coverage of the field, which is impossible even when taking soil samples on
an intensive grid.
5. Soil Sampling
Field soil samples can be taken using several different methods. The standard
method of soil sampling is for each field to be represented by a single composite
soil sample which is a mix of several (5 to 10) sub-samples taken throughout
the field (generally a single composite sample can represent a maximum size
of 4 ha). These sub-samples must represent "average" conditions in the field,
that is, the sub-samples should not be taken at field edges, in small depressions,
where fertilizer was stacked, where manure was piled or in any other small unrepresentative
zone. Sub-samples taken in these locations can have extremely high or low levels
of soil nutrients and thus do not represent the average conditions of the field.
An un-representative sub-sample will affect the nutrient levels of the single
composite sample and therefore change the fertilizer recommendations. Composite
soil samples that represent entire individual fields are not geo-referenced.
Geo-referenced soil samples that are used for PA can be taken in one of three
ways. By using systematic soil sampling the samples are taken on an intensive
grid, for example 40 by 40-m, over the whole field. For many commercial firms,
the standard sampling density is one composite sample per hectare, but not on
a true grid. The final method uses directed sampling in which soil samples are
taken in zones within the fields that are selected by using aerial photos, topography
or yield maps. In these three methods the soil samples are geo-referenced. This
implies for example that the soil P level has an exact latitude and longitude
position in the field. Geo-referenced soil samples are required so that the
maps of nutrient levels can be used together with the yield maps to help explain
variability in the yield.