 Soil
Maps
Soil
Maps Management Zones
A "management zone" is a sub-region of a field that shows the same combination of yield-limiting factors for which a single rate (or management practice) of a specific crop input (or field operation) is appropriate. The establishment of management zones is simply a way of classifying the spatial variability within a field. To be successful, the strategy used to create the zones must be based on the real cause and effect relationships between field characteristics and crop yield.
The most meaningful factors to include in establishing management zones are those with the most direct effect on crop yield. Examples are: the soil moisture relationship to crop yield- sandy soils versus clay soils, soil pH, weed patches, and extremes in soil nutrient levels. The problem in many cases is that crop yield patterns from yield maps may not be stable enough across several years to accurately determine the management zones. Field maps of soil electrical conductivity (E.C.) (see Appendix II for further details) or color may lead to an incorrect determination of zones unless they are carefully correlated with factors that directly affect the crop.
Table 4 gives the possible soil and crop factors to
use when separating the field into different zones that would have different
management practices such as lime applications or varying rates of applied manure.
The following Figures 1 and
2 show
two management zones based on the potassium: magnesium (Mg) ratio and the crop
yield. The levels of K to Mg result from the combination of the soil texture,
manure applications and K applications. The two low yielding zones are a result
of the K: Mg ratio being extremely high. The recommended ratio is 0.5, however
in this case yield reduction occurred when the ratio exceeded 3. Corrective
measures either involve finding a Mg fertilizer source or limit the K fertilizer
applied in this area. As the solid manure is used to build up organic matter,
K will still be applied.
Soil
Maps
Soil nutrient levels, pH, organic matter % and texture can all be mapped using geo-referenced data. However, the major limiting factor is the cost. Most commercial operations will sample on the order of one composite soil sample per one hectare. Thus a 6 ha field will be represented by 6 sample points. The choice of where to take the samples or how to divide up the field will determine the appearance of the soil map and it could be misleading. The soil maps for phosphorus, potassium, pH etc are produced by interpolating the value for each particular nutrient between the sample points by a mathematical formula. However, a low number of sample points results in less reliable values for the interpolated areas - the areas between the sample points (generally most of the field). Often the appearance of the map will show "bulls eyes" with rings of decreasing or increasing values around the point because it is impossible to accurately determine the level of a nutrient between the actual known values. Compare Figure 3 (six-sample points) to Figure 4 (82-sample points).
Grid soil maps can be useful if the cause of the yield variability is due to nutrient levels or pH. Phosphorus, potassium and lime can be applied in varying amounts though this depends on the size of the management zones. However, before the expense of grid soil maps, it is important to first carefully examine the yield maps and determine the true cause of yield reduction. In some cases the intensive sampling on a grid will be beneficial in terms of the environment, showing zones of extremely high P which will have to be managed with care. Alternatively if the field has a large range in P values, (50 to 500 kg/ha), then there may be zones that could receive a higher application of P in the form of inorganic fertilizer or by manure applications. Only by using intensive grid sampling will these zones of low P be located.
Table 4: Establishment of Management Zones
|
Crop and Field Inputs |
Management Zone Factors to Use |
| Immobile nutrients such as P and K | topography/landscape. grid or directed soil test analyses (geo-referenced), bare soil photo- aerial, soil survey maps (small scale), soil Electrical Conductivity (EC) map |
| Nitrogen (mobile) and manure | soil texture, organic matter, yield zones (patterns), bare soil photo - aerial, soil NO3-N levels for side-dressing, crop canopy reflectance - remote sensing photos, soil P levels |
| Lime | soil pH, buffer pH, soil texture |
| Seeding Rate | historical yield levels, topsoil depth mechanical tillage for weed control |
| Herbicides | weed maps or observations, soil organic matter, soil texture, residue cover |
| Pesticides |
soil properties, scouting reports |
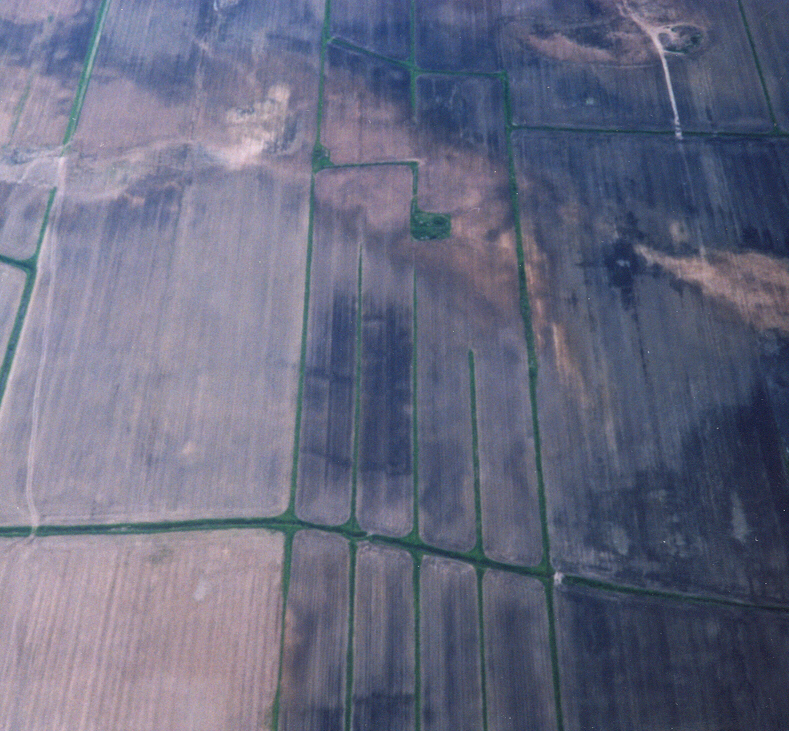
| Drainage | black and white aerial photos, crop colour (yellowing), tile drain maps |
| Water (soil moisture conditions) | soil texture, topography, soil organic matter, Yield zones |