Case Studies: Champ F
Field History
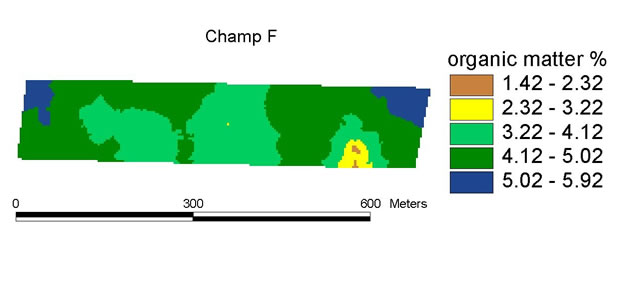
Champ F is located south of Montréal. The aerial photo shows some darker spots but these areas do not correspond to the spatial patterns on the soil moisture map (Figure 1 ) or on the organic matter map (Figure 2 ). The field has a heavy clay soil texture and as seen in the elevation map (Figure 3 ) the field is flat as there is less than a 1-m difference over the 700-m length of the field. The grid soil sampling was less dense than the other seven fields, with a density of six samples per ha and a total of 33 samples taken in the five ha field. Figure 3 shows the grid-sampling pattern. The lower number of samples resulted in soil parameter maps with circular patterns. There were not enough values to perform a good interpolation between the sample points. The greater the number of sample points, the greater the accuracy of the interpolated values. This field did not have any yield maps from previous years. The grain corn was hand- sampled at 30 of the 33 sample pints, and the central points are missing.
Phosphorus & Potassium
The phosphorous distribution (Figure 4 ) is relatively uniform with a range of 85-246 kg P/ha and a mean value of 144-kg P /ha. The recommended rate of fertilizer P is 40 kg P2O5/ha and on this field 47 % of the area received the recommended rate while 18% was under-fertilized and 35 % was over-fertilized (based on the average P value). The potassium levels are high ranging from 284 to 820 kg/ha with an average value of 454-kg K/ha (Figure 5 ). The high levels of K are common for heavy clay soils. The clays retain and hold the potassium against leaching (much lower values are found in sands). Both the P and K patterns show no relationship to the yield map.
Crop Yield Patterns B Unaltered
Generally for a five ha field there would be 20,000 yield points from the combine (compare to the 30 points which were hand-sampled). The average corn yield in 1999 was 7.9 t/ha, with a range of 4 to 12 t/ha (Figure 6 ) . Yields were higher in the western 2/3 of the field and this area was also higher in elevation. It is possible that the eastern lower end of the field (also the headlands) was compacted or had poorer drainage which reduced the yields (runoff would flow in this direction).
Crop Yield Patterns B Normalized
Figure 7 shows the normalized yield map, where in 1999 55 % of the field had a yield +/- 10% of the average yield (equal to 100 %). High yields were found on 24 % of the area. The low yielding area (eastern 1/3 of the field) corresponds to a change in soil texture. A higher percentage of silt (Figure 8 ) is found in this zone compared to the rest of the field. The silt fraction of the soil can cause problems with drainage and it does not form strong soil aggregates. In this low yielding zone, calcium levels (Figure 9 ), the soil pH (Figure 10 ) and magnesium levels (Figure 11 ) are all lower but all values are more than sufficient to satisfy crop requirements. The levels are higher than many of the other fields in these case studies. Organic matter % (Figure 2 ) is lower in this zone which could be a reflection of poorer crop growth (lower root and crop residues returned to the soil) and this lower level would affect the infiltration of water into the soil (organic matter helps form strong aggregates which increases porosity).
Spatial, Temporal and Classified Management Maps
These management maps require several years of yield data that were unobtainable for this field.
Soil Physical and Nutrient Maps
The P saturation % distribution is shown in Figure 12 and the aluminum levels in Figure 13 . The P saturation levels were all low, with the lowest levels found in the low yielding zone (higher silt fraction) as the Al concentration was the highest in this area. The aluminum was not at a level that could be toxic to plant growth. The pH (Figure 10 ) in this zone is between 5.9-6.2 which is low for corn but not extremely low. The low-yielding problem area is a silty clay while the rest of the field is classed as a heavy clay. The clay (Figure 14 ) and sand (Figure 15 ) percentages can be entered on the following WebSite to determine the soil textural class http://www.ncat.edu/~lik/wetland/images/Stt.html . Levels of ammonium-N (Figure 16 ) and nitrate-N (Figure 17 ) were determined on samples taken in July/00 and were low over the whole field with an average of 19-kg nitrate-N/ha.
Conclusions & Recommendations
The zone that was low yielding corresponds to a soil textural change that cannot be altered by management. But as this zone also has a low organic matter content and additional organic matter could be added that would improve the soil structure and thus water infiltration. When the sampling was done in 1999 and 2000, there was no indication of standing water on the field or a reduction in crop height (indicators of poor drainage). Crop colour was uniformly good, no stripping or pale green.